

Replicating the IPCC 1.5°C Pathways
How Far Observed Emissions Have Diverged from SR1.5 / AR6
This replication rebuilds the IPCC 1.5°C emissions pathways from public data and lines them up against what the world has actually emitted.
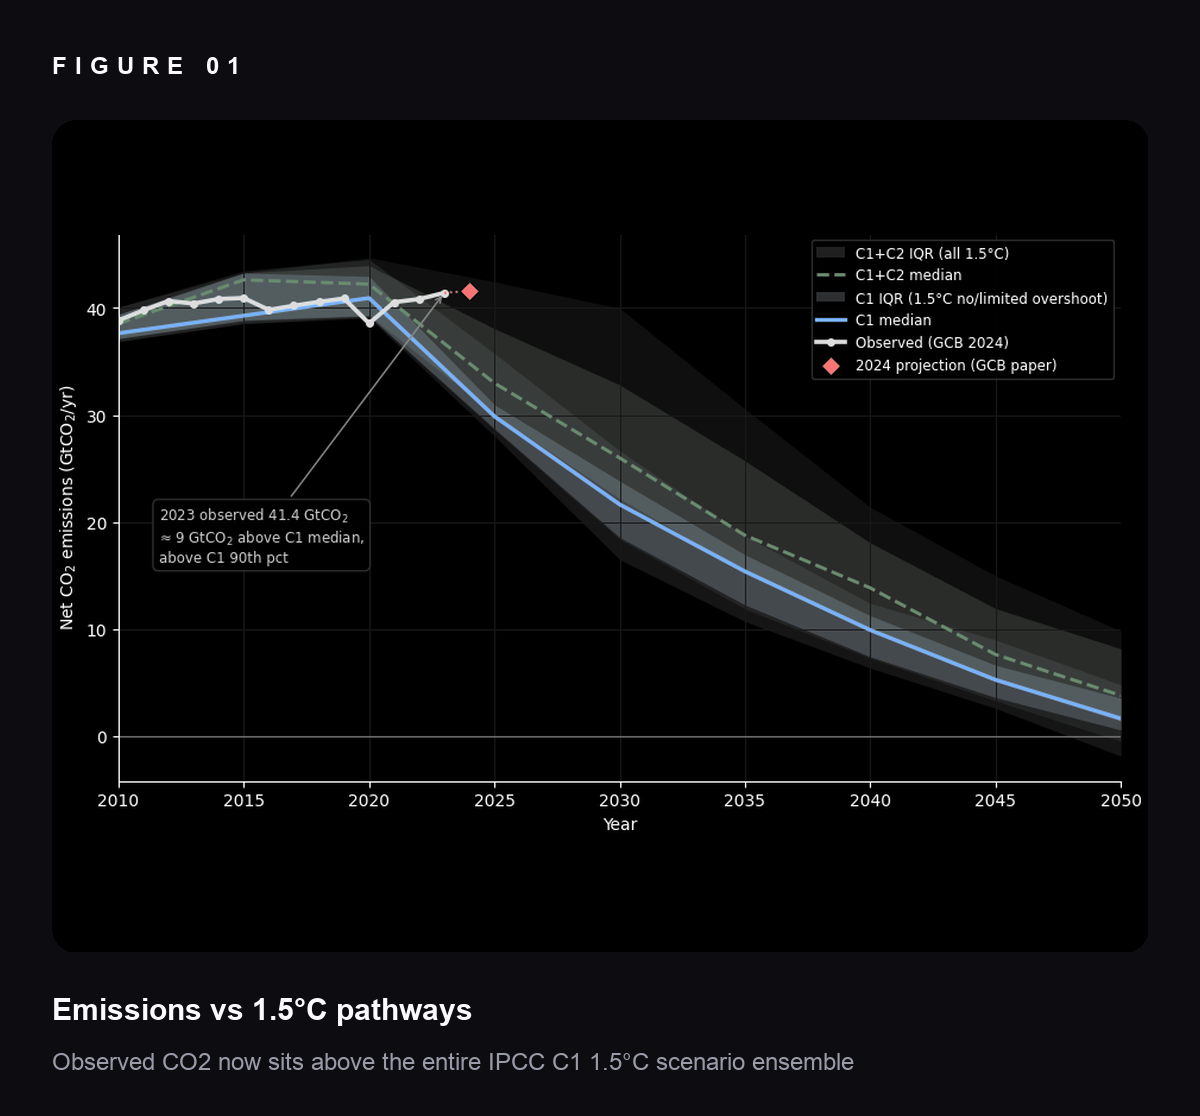
Observed CO₂ reached 41.4 GtCO₂ in 2023 — roughly 9 GtCO₂ above the median 1.5°C pathway, and past the top of the entire IPCC C1 scenario ensemble. On current budgets, the 1.5°C target is no longer compatible with any plausible carbon-budget assumption.
The analysis then turns the gap into timelines: how much carbon budget is left, how many years that buys at today's rate, and how steep the annual cuts would have to be to stay within 1.5°C or 2.0°C.
How far have observed CO₂ emissions diverged from the IPCC 1.5°C pathways, and what emission cuts would now be required to stay within the remaining 1.5°C and 2.0°C carbon budgets?
The IPCC's 1.5°C target rests on modelled emissions pathways and a finite carbon budget — the total CO₂ that can still be released before the target slips out of reach. Those pathways were published as scenario ensembles, and the budget as a range that reflects genuine scientific uncertainty. This study reconstructs both from their public sources — observed emissions from the Global Carbon Budget 2024, and 475 scenarios from the IIASA AR6 database — and compares them directly. It then works through several carbon-budget estimates (AR6, Lamboll 2023, Forster IGCC 2025) to translate the remaining space into years left and the annual decline rates each target implies.
- 2023 emissions of 41.4 GtCO₂/yr sit about 9 GtCO₂ above the median 1.5°C pathway — already past the 90th percentile of the entire IPCC C1 ensemble
- The AR6 1.5°C carbon budget (67% probability) is 51% spent, leaving under 5 years at current emission rates; the tightest recent estimate leaves about 3
- Staying within 1.5°C now demands 14–32% annual emission cuts versus +0.24%/yr observed, while 2.0°C remains feasible at a still-steep 3.7–4.6%/yr
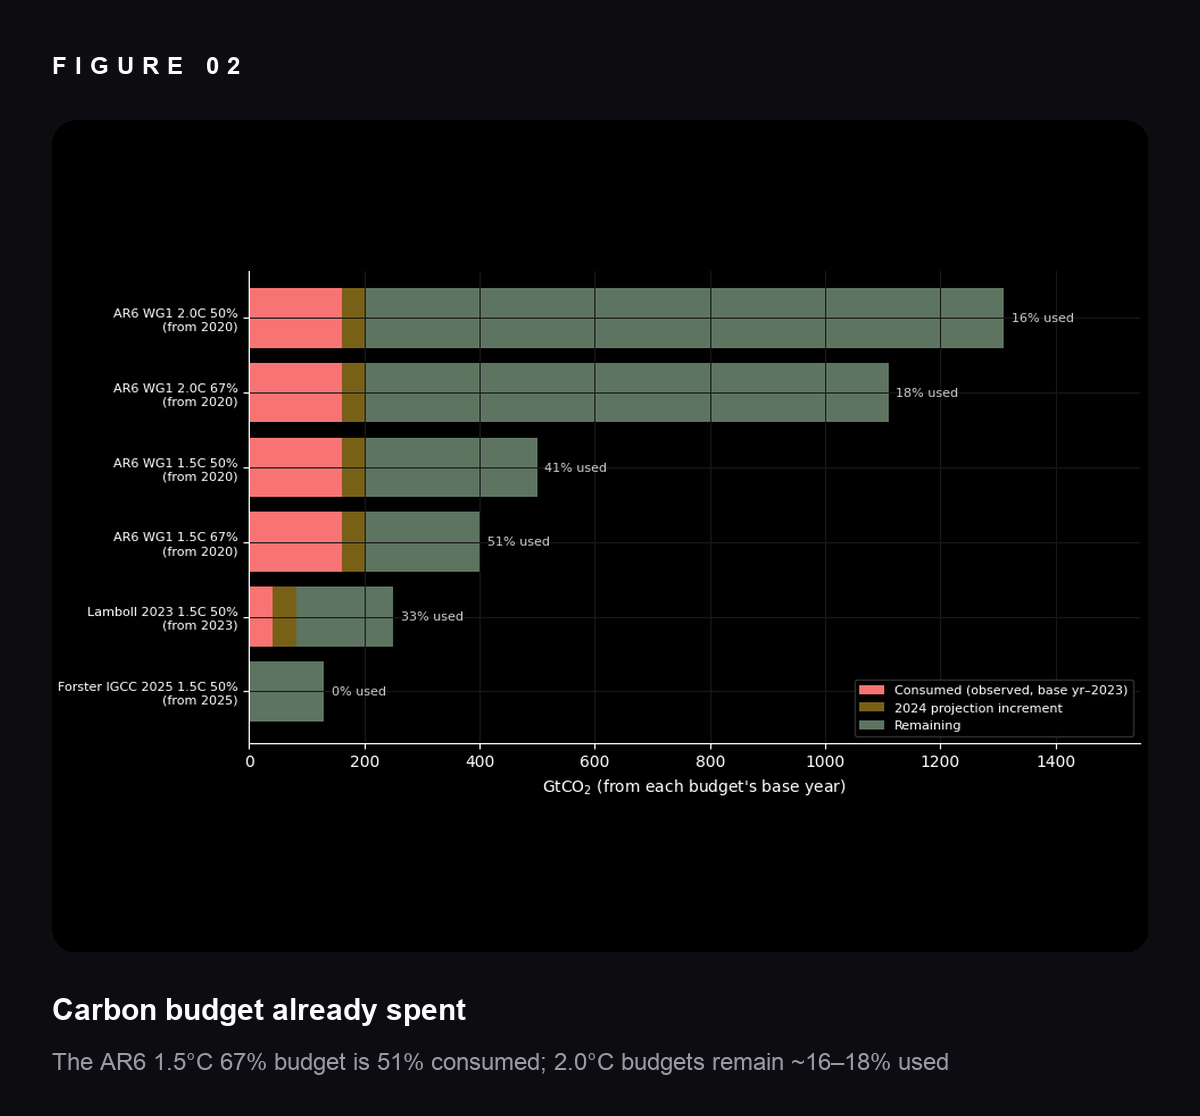
Carbon-budget estimates vary widely — from 130 to 500 GtCO₂ for 1.5°C — because they rest on different Earth System Model ensembles, forcing assumptions, and probability interpretations. That spread is real scientific uncertainty, not a rounding choice, and it drives much of the range in years remaining.
The “years left” figures assume emissions stay flat at 2023 levels. The small observed trend (+0.24%/yr over 2013–2023) would exhaust budgets slightly faster, while any real decarbonization would extend them. The 2024 emissions figure is a published projection rather than a full-year observation.
The scenario ensemble skews toward baseline and intermediate policy cases, so the median pathway is not a policy-optimized trajectory. The analysis is global aggregate only — no country or sector breakdown — even though mitigation feasibility varies sharply by region.